> ## Documentation Index
> Fetch the complete documentation index at: https://visitdocs.planpoint.io/llms.txt
> Use this file to discover all available pages before exploring further.
# Analytics
> See which rooms hold attention, where visitors drop off, and what they ask the AI for.
Analytics requires the Pro plan.
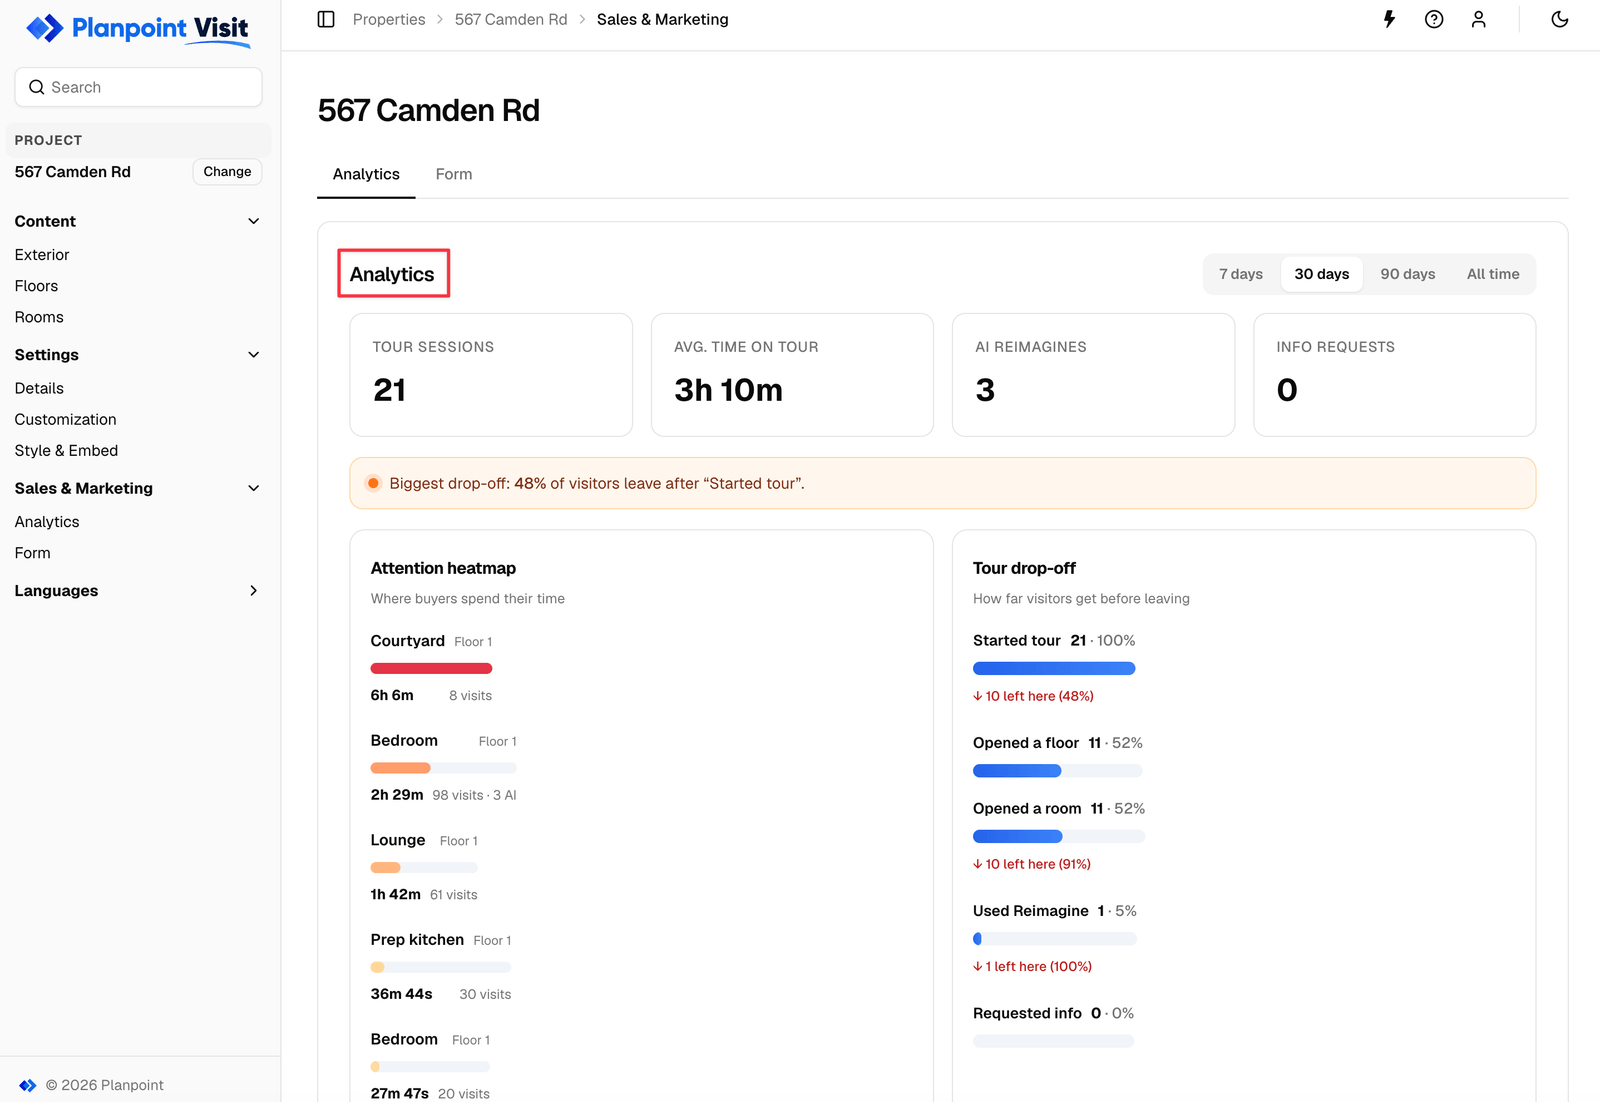
Open a property and go to **Analytics**. Pick a range — **7 days**, **30 days**, **90 days** or **All time** — and the whole page updates.
 ## Summary metrics
| Metric | What it tells you |
| ----------------- | ----------------------------------------------------------------- |
| **Sessions** | How many visits the property received |
| **Avg. time** | How long a visitor stays — the clearest interest signal |
| **Reimagines** | How often visitors restyled a room with [AI](/features/reimagine) |
| **Info requests** | Enquiries sent through the [form](/features/forms) |
A short average time with high session numbers usually means the link is being clicked but the first impression is not landing — check the exterior photo and the property description.
## Attention heatmap
The heatmap overlays your floor plan and shades each room by the attention it received.
## Summary metrics
| Metric | What it tells you |
| ----------------- | ----------------------------------------------------------------- |
| **Sessions** | How many visits the property received |
| **Avg. time** | How long a visitor stays — the clearest interest signal |
| **Reimagines** | How often visitors restyled a room with [AI](/features/reimagine) |
| **Info requests** | Enquiries sent through the [form](/features/forms) |
A short average time with high session numbers usually means the link is being clicked but the first impression is not landing — check the exterior photo and the property description.
## Attention heatmap
The heatmap overlays your floor plan and shades each room by the attention it received.
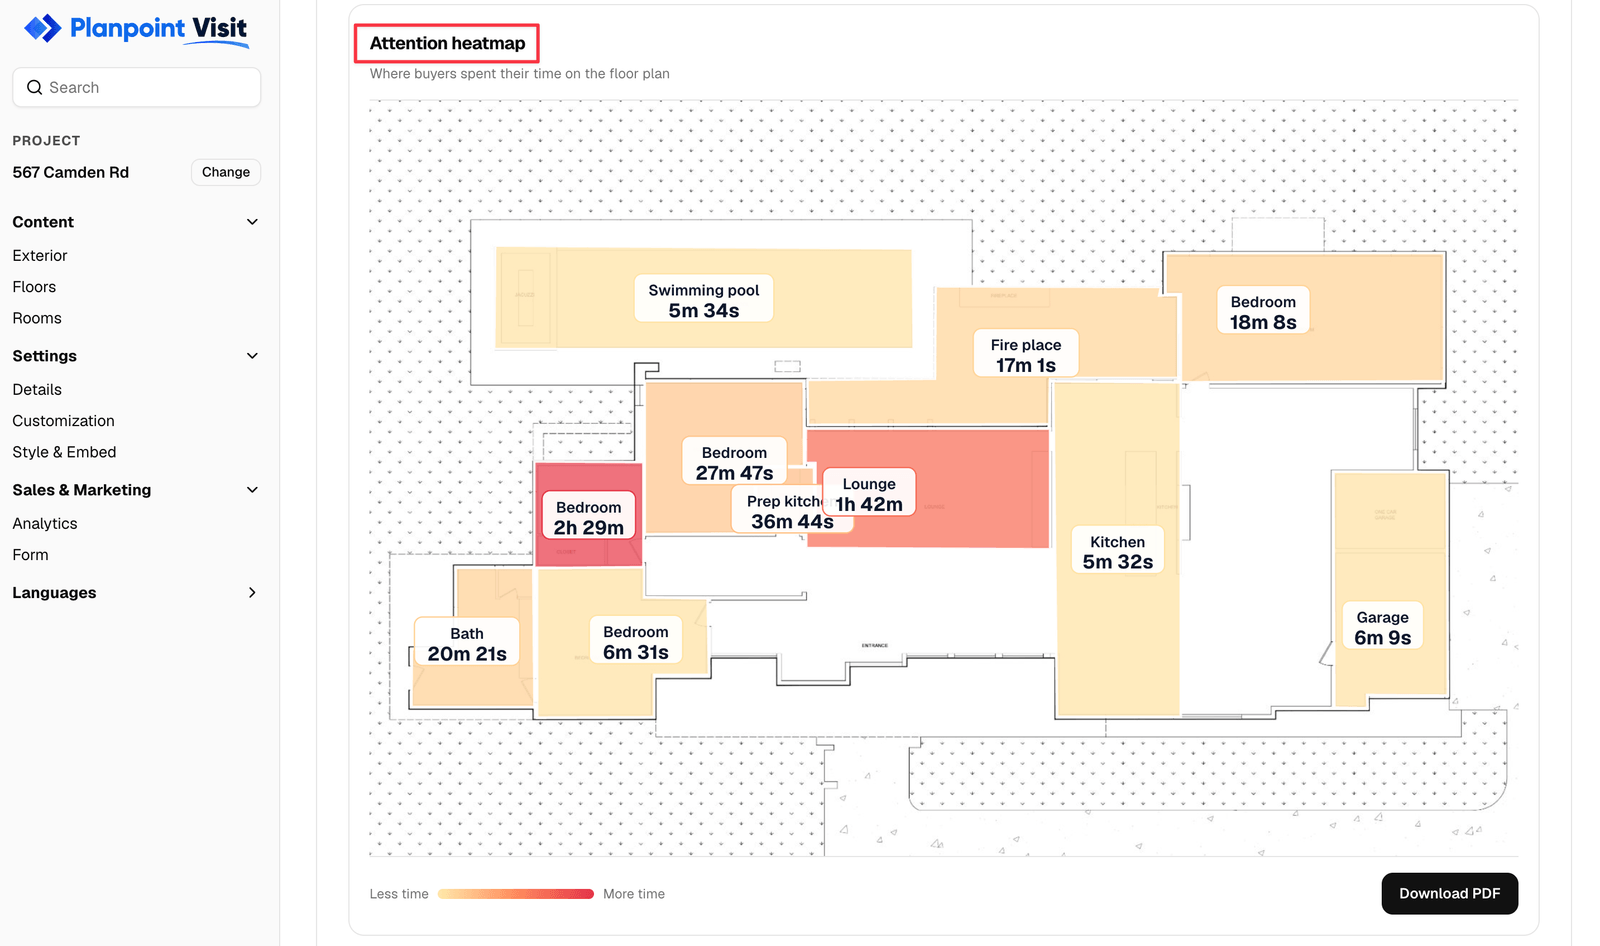 Use **View on floor plan** to open it full size, and **Download PDF** to export it — a heatmap is a persuasive thing to put in front of a vendor.
## Drop-off funnel
The funnel shows how far visitors get: arriving on the exterior, opening a floor, entering rooms, and beyond. The **biggest drop** is called out for you.
* Losing people at the **exterior** — the photo or the price is the problem
* Losing people at the **floor plan** — the plan image may be low quality or missing
* Losing people **inside rooms** — the room photography is not carrying the property
## Top prompts
The most-used [Reimagine](/features/reimagine) prompts for this property. It is unusually direct market feedback: a run of *modern*, *minimalist* prompts on a dated interior tells you exactly how the property is being received.
## Using it in a vendor meeting
Concrete proof of activity, not "we've had some interest".
Vendors immediately understand which rooms sell their home and which do not.
A big exterior drop-off is an argument for a re-shoot or a price conversation, backed by data.
## Notes
* Data is aggregated and anonymous; there is no per-visitor tracking.
* Numbers appear within a few minutes of a visit.
* A brand-new Visit will read zero until you share the link.
Use **View on floor plan** to open it full size, and **Download PDF** to export it — a heatmap is a persuasive thing to put in front of a vendor.
## Drop-off funnel
The funnel shows how far visitors get: arriving on the exterior, opening a floor, entering rooms, and beyond. The **biggest drop** is called out for you.
* Losing people at the **exterior** — the photo or the price is the problem
* Losing people at the **floor plan** — the plan image may be low quality or missing
* Losing people **inside rooms** — the room photography is not carrying the property
## Top prompts
The most-used [Reimagine](/features/reimagine) prompts for this property. It is unusually direct market feedback: a run of *modern*, *minimalist* prompts on a dated interior tells you exactly how the property is being received.
## Using it in a vendor meeting
Concrete proof of activity, not "we've had some interest".
Vendors immediately understand which rooms sell their home and which do not.
A big exterior drop-off is an argument for a re-shoot or a price conversation, backed by data.
## Notes
* Data is aggregated and anonymous; there is no per-visitor tracking.
* Numbers appear within a few minutes of a visit.
* A brand-new Visit will read zero until you share the link.