

Pro feature
Analytics requires the Pro plan.
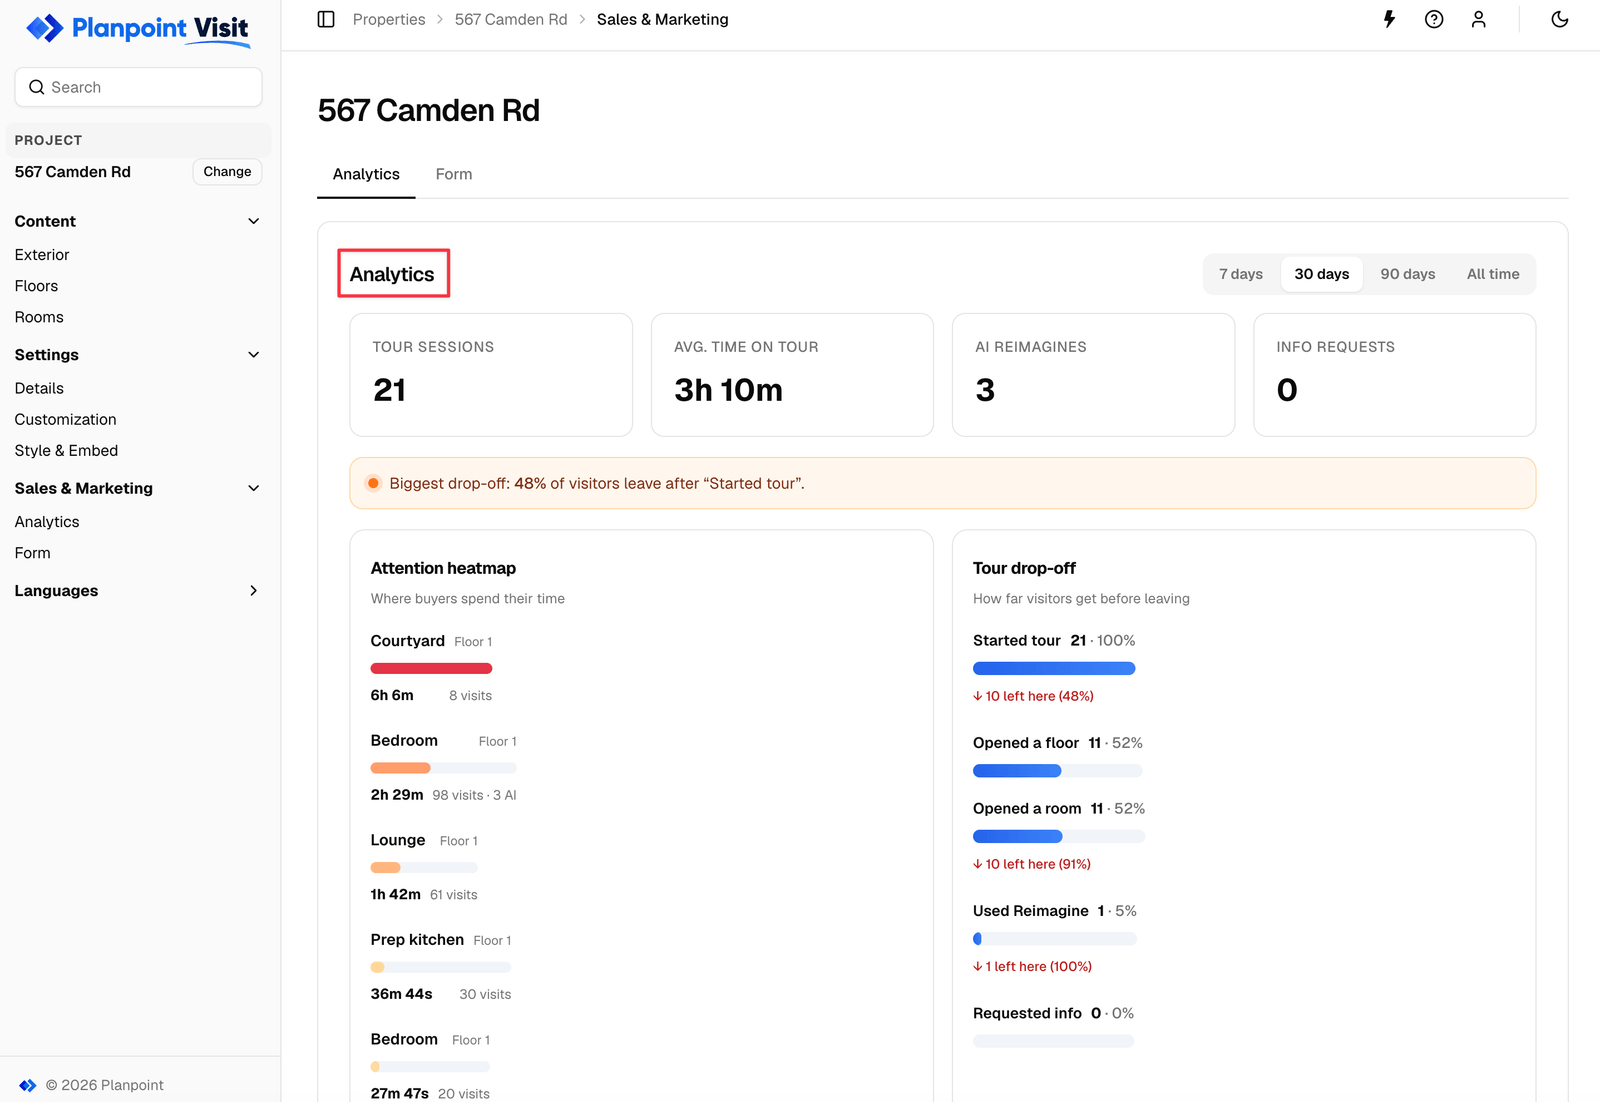
Analytics — engagement for a single property
Summary metrics
A short average time with high session numbers usually means the link is being clicked but the first impression is not landing — check the exterior photo and the property description.
Attention heatmap
The heatmap overlays your floor plan and shades each room by the attention it received.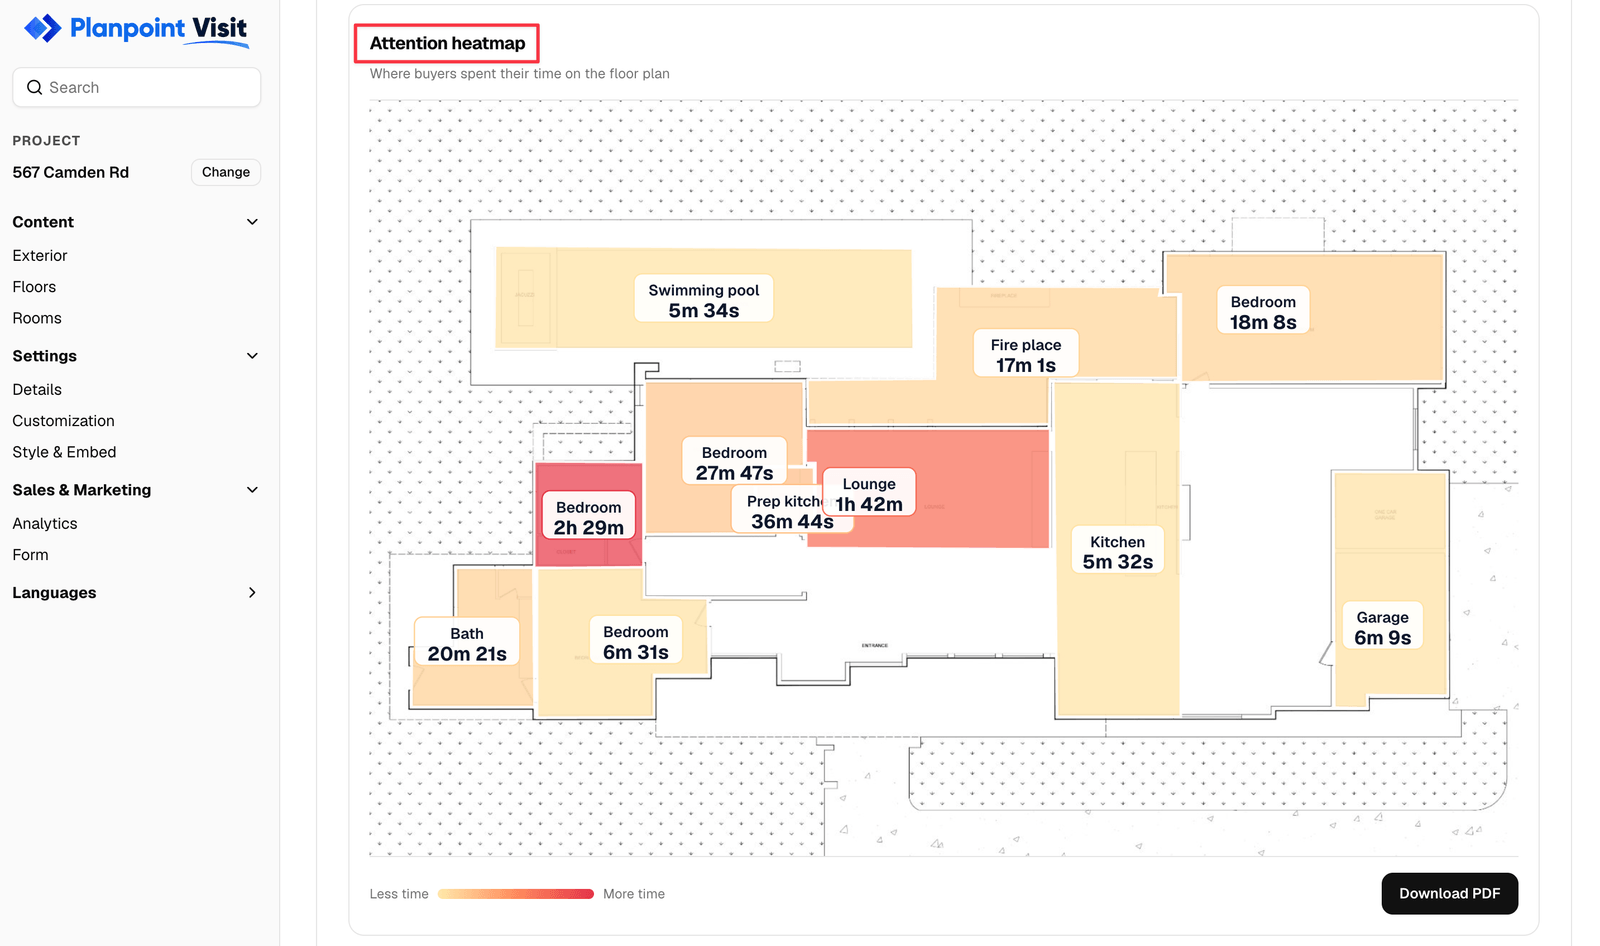
Attention heatmap — hot rooms are the ones being studied
Drop-off funnel
The funnel shows how far visitors get: arriving on the exterior, opening a floor, entering rooms, and beyond. The biggest drop is called out for you.- Losing people at the exterior — the photo or the price is the problem
- Losing people at the floor plan — the plan image may be low quality or missing
- Losing people inside rooms — the room photography is not carrying the property
Top prompts
The most-used Reimagine prompts for this property. It is unusually direct market feedback: a run of modern, minimalist prompts on a dated interior tells you exactly how the property is being received.Using it in a vendor meeting
1
Lead with sessions and time
Concrete proof of activity, not “we’ve had some interest”.
2
Show the heatmap
Vendors immediately understand which rooms sell their home and which do not.
3
Use the funnel to make a recommendation
A big exterior drop-off is an argument for a re-shoot or a price conversation, backed by data.
Notes
- Data is aggregated and anonymous; there is no per-visitor tracking.
- Numbers appear within a few minutes of a visit.
- A brand-new Visit will read zero until you share the link.